Overview
The Network Design module analyzes historical load activity to help carriers identify efficient lane structures, bid opportunities, and multi-lane tours. By evaluating shipment volume, geographic patterns, and routing possibilities, the system recommends a network structure that reduces empty miles and improves operational efficiency.
After optimization runs, the system identifies:
-
Core lanes supported by shipment volume
-
Empty lane opportunities that complement the network
-
Bid opportunities based on market demand
-
Cycles, which represent multi-lane tours designed to minimize deadhead
Each result can be viewed through both interactive maps and data grid tables to help planners understand how the network operates.
When to Use It
Use Network Design when you want to:
-
Understand how your historical freight naturally forms reoccuring lanes in your network
-
Identify new lane opportunities to pursue
-
Evaluate empty mile opportunities that could complete tours
-
Design multi-stop or multi-lane tours for better utilization
-
Prepare for contract bidding cycles
-
Evaluate network performance across markets
This module is particularly useful for strategic planning, bid preparation, and network expansion analysis.
How Network Design Works
The process follows a structured workflow:
-
Sync operational data
Loads, customers, and locations must first be imported or synchronized with the system.
-
Create a Network Design Study
Define the dataset and filters used for analysis.
-
Import Markets and Bid Data
These provide geographic groupings and bid lane opportunities.
-
Run the Optimization Engine
The engine evaluates shipment volume and routing possibilities to determine optimal lanes and tours.
-
Review Results
The system generates:
-
Market insights
-
Lane opportunities
-
Bid opportunities
-
Network cycles (tours)
-
-
Export Reports
Results can be exported to evaluate KPIs and support network planning decisions.
Understanding the Results
The Network Design module presents results across several analysis areas.
Markets
Markets represent geographic hubs where freight volume originates or terminates. The system analyzes inbound and outbound volumes to determine network balance at these hubs encompassing all origin and destination points within a given radius of these locations. These often equate to Zones for our Dispatch Planning product.
Lanes
Lanes represent consistent freight flows between markets that meet volume thresholds.
Empty Lanes
These are complementary lanes that help reduce empty miles and support round-trip network efficiency.
Bids
Bid opportunities highlight lanes where contract freight demand may exist.
Cycles
Cycles represent multi-lane tours, showing how drivers could move through multiple lanes before returning to the origin market.
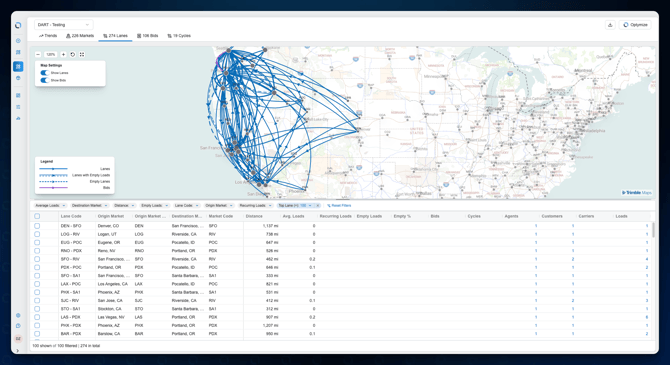
Visual and Analytical Views
Each analysis area includes two primary views:
1. Map View
Displays inbound and outbound connections between markets using directional routing.
2. Data Grid
Provides detailed metrics such as:
-
Load volume
-
Distance
-
Recurring loads
-
Empty mile opportunities
-
Bid counts
-
Lane usage
Together these views help planners understand both the geography and the economics of the network.
Tips or Notes
-
The quality of Network Design results depends heavily on accurate historical load data.
-
Using at least 3–12 months of history typically produces the most reliable lane patterns.
-
Empty lane recommendations may represent potential opportunities rather than existing freight.