
Table of Contents
Key Use Cases
- Identify freight-vs-driver imbalances by region and zone — excess pickup demand with too few available drivers, or surplus drivers with little demand.
- See upcoming pickup demand broken out by urgency: missed, must-pick-up, newly available, and all available.
- Spot driver availability where the gap is long enough to be worth acting on.
- Drill from any rolled-up count straight into the underlying trips or drivers.
- Set up custom planning regions that group zones to match how you actually run — for example, finer zone groupings for a large Flatbed fleet alongside broader regions for a smaller Dry Van operation.
Navigation Overview
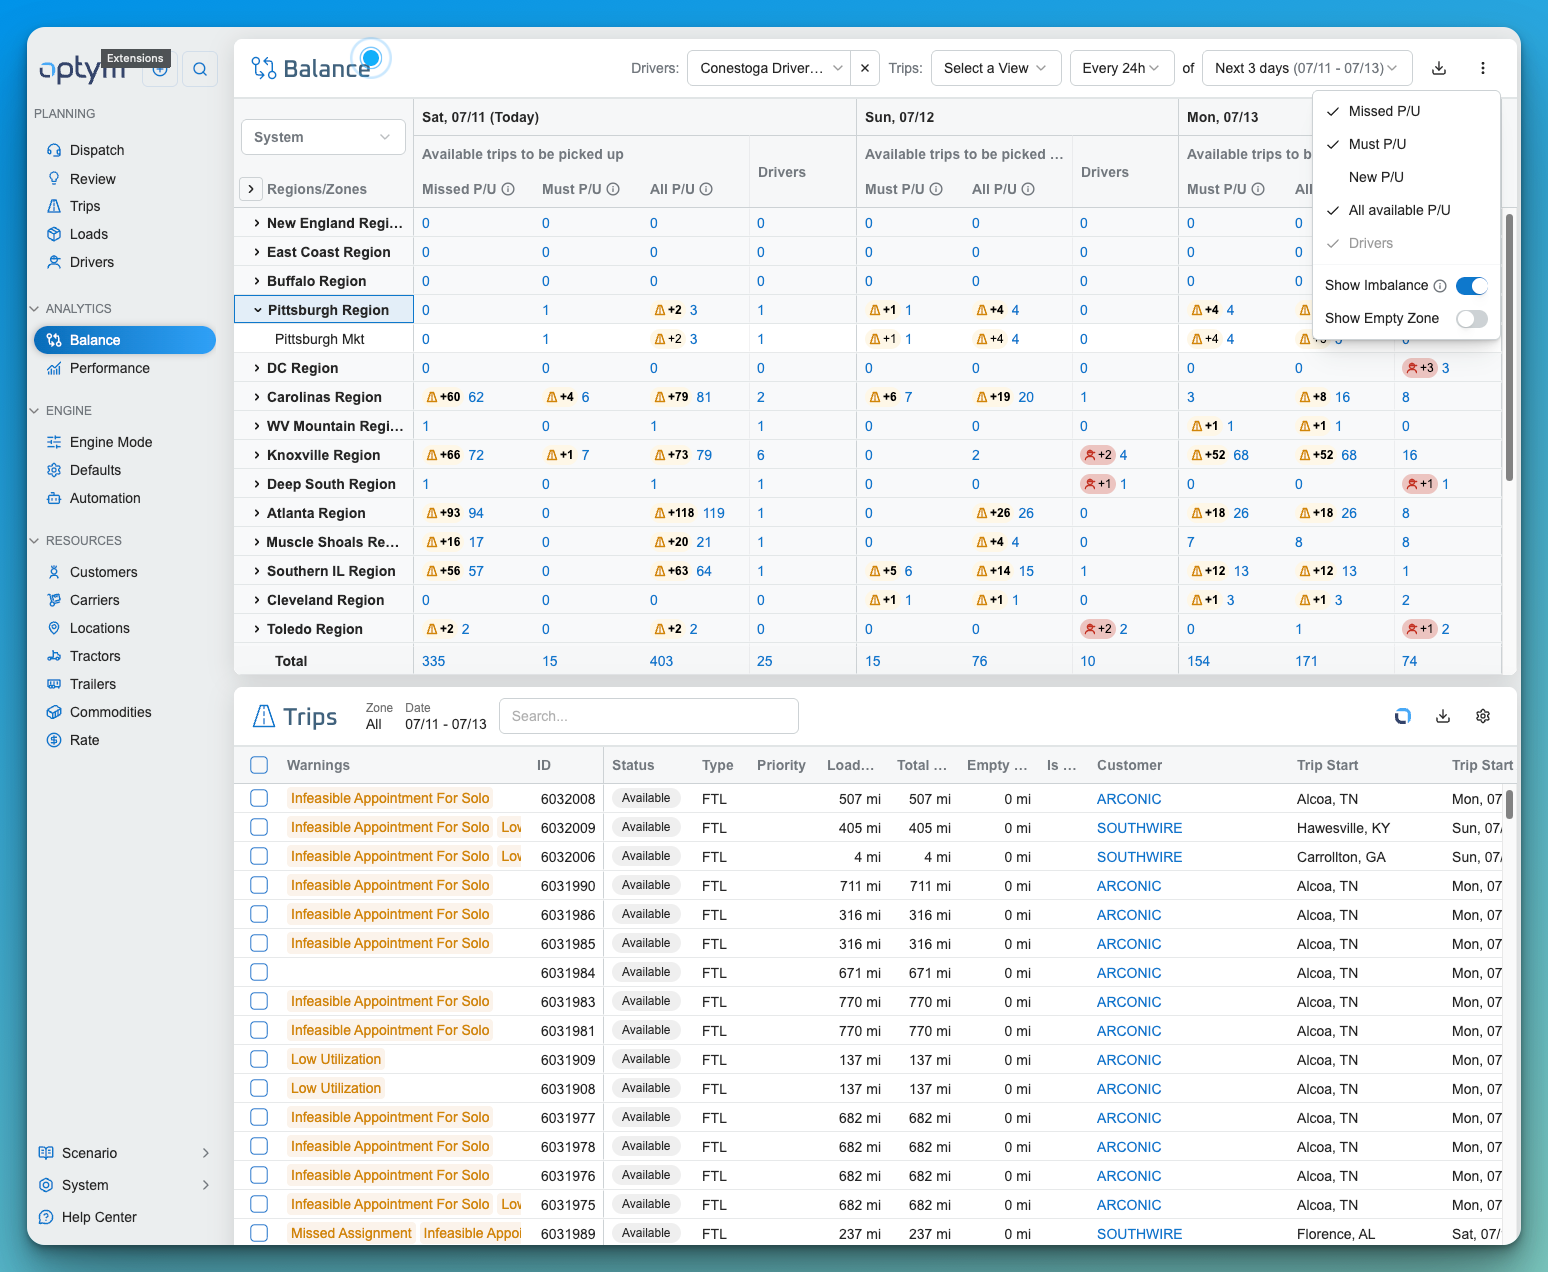
Navigate to Analytics > Balance from the left-side menu.
The page consists of two sections:
- Top panel: the Balance grid — regions and zones down the rows, time periods across the columns.
- Bottom panel: the detail table (trips or drivers) behind whatever count you click.
How the Balance Grid Works
Rows — regions over zones. Rows are organized as Regions that roll up their constituent Zones. Expand a region to see its per-zone counts. A Total row summarizes the grid at the bottom.
Columns — pickup demand and driver supply. Each period column reports:
| Column | What it shows |
|---|---|
| Missed P/U | Pickups whose pickup window has already passed. |
| Must P/U | Trips that need to be picked up in this period — either the pickup window ends here, or waiting any longer would risk missing the delivery appointment. |
| New P/U | Trips that become newly available for pickup in this period. |
| All Available P/U | Every trip that could be picked up in this period — includes Must P/U and New P/U loads, plus loads whose pickup windows also extend into later periods. |
| Drivers | Drivers whose availability gap in this period is long enough to be worth planning around (see below). |
Every count is a hyperlink — click it to load the underlying records in the bottom panel.
When a driver counts in the Drivers column. A driver is only counted when their availability gap is long enough to represent a real assignment opportunity. The minimum gap is set by operating type and starts at:
| Operating type | Default minimum gap |
|---|---|
| Local | 0.5 hours |
| Regional | 4 hours |
| OTR (over-the-road) | 6 hours |
These are starting defaults and can be adjusted by your team.
Imbalance badges. When trips and drivers don't line up in a zone for a given period, an imbalance badge appears. The badge shows the overage count and sits on whichever side is larger — because that's the side that needs to be planned differently. For example, a zone with 12 available trips and 5 available drivers shows +7 on the trips side; if drivers outnumber trips, the badge appears on the drivers side. Use the Show Imbalance toggle to turn badges on or off.
You can also use column visibility controls to choose which pickup columns and the Drivers column appear in the grid.
Period & Horizon
Use the dropdown menus above the grid to control your view:
-
Two controls above the grid set the time layout:
- Period duration — the bucket size for each column: 6h, 8h, 12h, or 24h. Buckets subdivide each day, so a 3-day view at 6h granularity produces 12 columns.
- Horizon — the total length of the view: 1 day, 3 days, or 7 days.
* These selections dynamically update the columns and total grid view.
Driver & Trip View Selectors
Driver & Trip View Selectors
These selectors control who and what the grid counts:
- Driver View — a saved driver filter (carried over from Dispatch) that determines which drivers are considered — for example by fleet, mode, or tag.
- Trip View — a saved trip filter (carried over from Trips) that determines which loads/trips are considered — for example contractual freight, high-priority shipments, or brokerable loads.
This is useful for scenario planning, dedicated-fleet analysis, or contract-compliance tracking.
Customized Balance Views
By default, Balance uses your account's standard region and zone groupings. A Customized Balance View lets planners view the same network through a different region/zone arrangement tailored to a business or geographic need — without changing the underlying zone assignments the optimization engine uses.
A common use is running different granularities for different freight types on one network: finer zone groupings for a large Flatbed fleet, alongside broader regions for a lower-volume Dry Van operation.
Each Customized Balance View captures a name, an optional description, a default Driver View, a default Trip View, and its zone groupings. Switching between views updates the grid layout and the active Driver and Trip filters at once — a single-click switch between operational lenses on the same network.
Customized Balance Views are shared across your account. Creating or editing them is limited to Admin users; everyone else can select and use existing views.
Detail Panel (Trips & Drivers)
Clicking any hyperlinked count opens the bottom panel with the records behind it.
- Trips — the trips behind a pickup count, showing Warnings, ID, Status, Type, Priority, loaded/empty miles, Customer, Trip Start and Trip Start Appointment, and Trip End and Trip End Appointment.
- Drivers — the drivers behind a driver count, so you can see where they're coming from, their next available location, and their PTA (Planned Time of Availability).
This lets you move directly from an aggregate imbalance figure to the specific trips or drivers driving it.
Trips Panel
The Trips Grid underneath the Balance Grid shows all trips within the selected time and zone range.
You can:
- Click on a Trip ID to open the Trip Detail Panel
- Select trips to initiate Optimization
- Sort or filter by Revenue, Customer, Appointment Time, Load ID
- Export data as CSV for downstream modeling or executive review
Driver Panel
When a user selects a 'Drivers' value for any given date and zone in the Balance Grid, the Driver Panel appears below the table, showing a filtered list of drivers available in that specific zone and window.
This table allows planners to:
-
View all available or inbound drivers contributing to that zone’s driver count
- Select drivers to initiate Optimization
-
Analyze where drivers are coming from, their next available location, and PTA (Planned Time of Availability)
-
Cross-reference driver zones, fleets, and domicile assignments
-
Prepare for repositioning or optimize driver-load pairing manually
* This panel helps bridge the gap between projected supply and demand, giving planners the ability to act immediately by assigning or relocating specific drivers.
Data Dictionary
|
Name |
Description |
Data Type |
|---|---|---|
|
Zone |
Defined geographic area (e.g., Northeast Zone) |
String |
|
Date |
Specific date (and optionally hour) of evaluation |
Date or DateTime |
|
Missed P/U |
Count of trips that are past the pickup window to start in the zone during that time bucket (only in the first time bucket) |
Integer |
|
Must P/U |
Count of trips that either have a pickup window that ends in this time bucket or have leave by the end of this time bucket in order to be delivered on time |
Integer |
|
New P/U |
Count of trips that the pickup window begins in this time bucket |
Integer |
|
All P/U |
All Trips that could be picked up in this time bucket |
Integer |
|
Drivers |
Count of drivers available in the zone during the same period |
Integer |
|
Imbalance |
Calculated difference: Drivers - Trips |
Integer |
|
Time Bucket |
Time slice for aggregation (6h, 8h, 12h, 24h) |
Enum |
|
Driver View |
Filter applied to determine which drivers are included |
Filter Tag |
|
Trip View |
Filter applied to determine which trips are included |
Filter Tag |
|
Trips Table |
All filtered trip records by ID, status, start time, location, etc. |
Table |